Molding Simulation for Glass Mat Thermoplastics (GMT)

"A two step-approach for molding simulation with GMT materials considering material forming and material flow."

Motivation

Long fiber thermoplastics (LFT) can be processed using injection or compression molding. Compression molding enables higher fiber lengths, making this manufacturing technology preferable for structural applications. Among LFT, the main driving force in the automotive industry for series applications was for a long time represented by the group of glass mat thermoplastics (GMT). 

With an eye toward the developments within the fourth industrial revolution, a digital twin of the manufacturing process is a powerful tool to support digital product development. Based on this, the part design can be optimized for manufacturability and required processing parameters can be determined. 

In this case study, a molding simulation for GMT materials is presented. The considered material is TEPEX® flowcore 102-RGR2400/47%, a GMT with an engineering polymer, i.e. PA6, which is manufactured by Lanxess, Bond Laminates. 

The results originate from a collaboration project between General Motors Research & Development, the University of Western Ontario (UWO), and the Institute for Vehicle System Technology (FAST) of the Karlsruhe Institute of Technology (KIT) and have been published previously by Dörr et al [1,2]. 

Key takeaways

  • Sequential simulation of material forming and material flow enables the prediction of GMT molding 
  • Wrinkling during material forming can be predicted solely under consideration of an anisotropic viscosity 
  • Mold filling during material flow can be predicted by existing approaches using the through-thickness viscosity 
  • The developed approaches are available through Simutence services for material card creation and molding simulation

Project partners

Material Classification

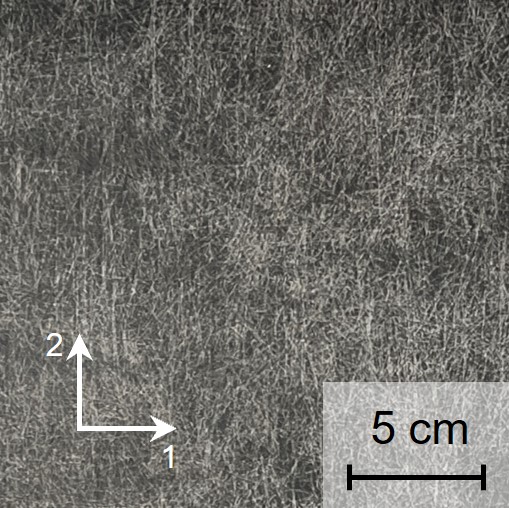
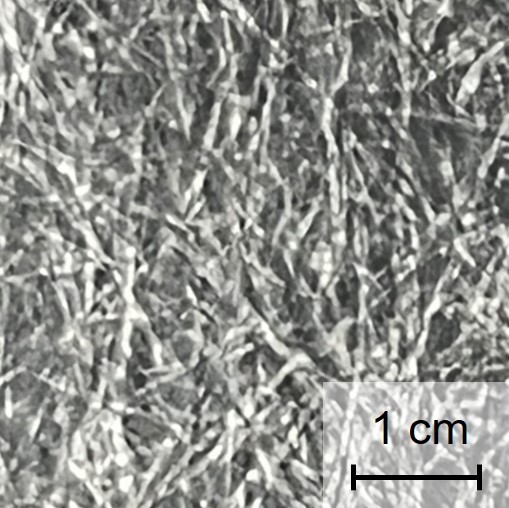
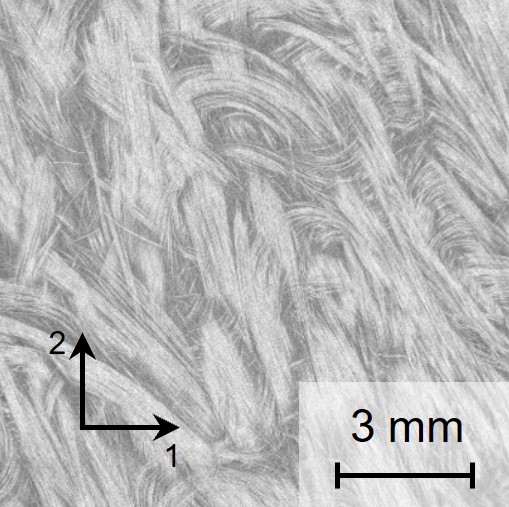
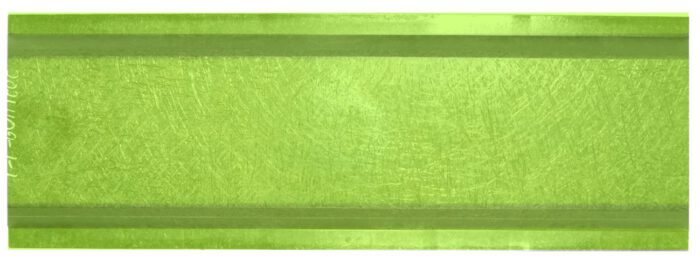
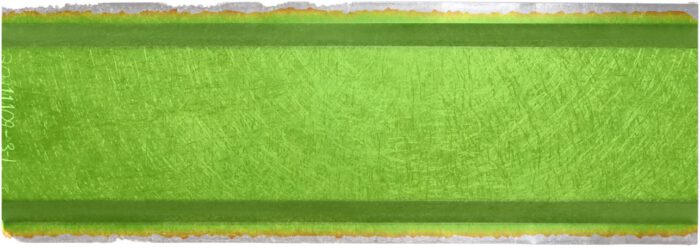
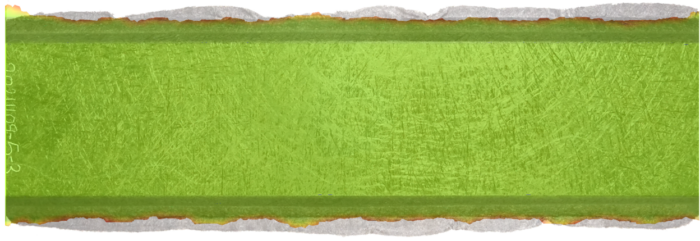
The semi-finished product of the investigated PA6 GMT material is manufactured in a continuous process and comes as a sheet in thicknesses ranging from 1 mm to 4 mm. The photographs of a 4 mm sheet reveal a macroscopically visible fiber structure with a long fiber length. Moreover, the photograph reveals rolling marks in the 1-direction, which indicate the direction of production of the sheet in the 2-direction.

Photographs of the investigated GMT material.

The semi-finished product of the investigated PA6 GMT material is manufactured in a continuous process and comes as a sheet in thicknesses ranging from 1 mm to 4 mm. The photographs of a 4 mm sheet reveal a macroscopically visible fiber structure with a long fiber length. Moreover, the photograph reveals rolling marks in the 1-direction, which indicate the direction of production of the sheet in the 2-direction.

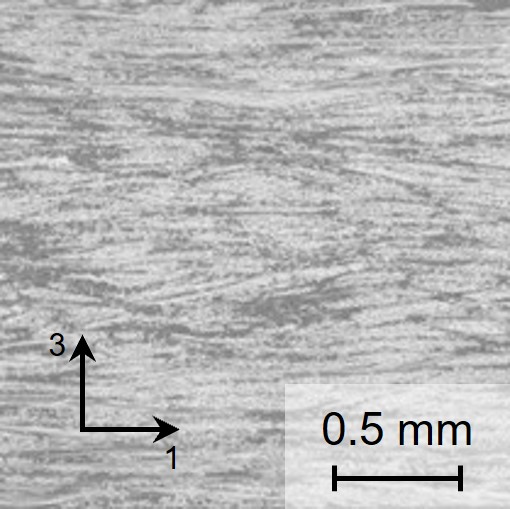
Grey value images from µCT scans: In-plane and through-thickness.

Rheological Characterization and Modeling

Accurate rheological characterization and modeling are essential for accurate molding analyses. In this study, an in-mold, as well as different rheometer setups for the characterization of viscosity are investigated. Moreover, an anisotropic viscosity model is adopted to capture the rheological behavior. 

In-mold characterization

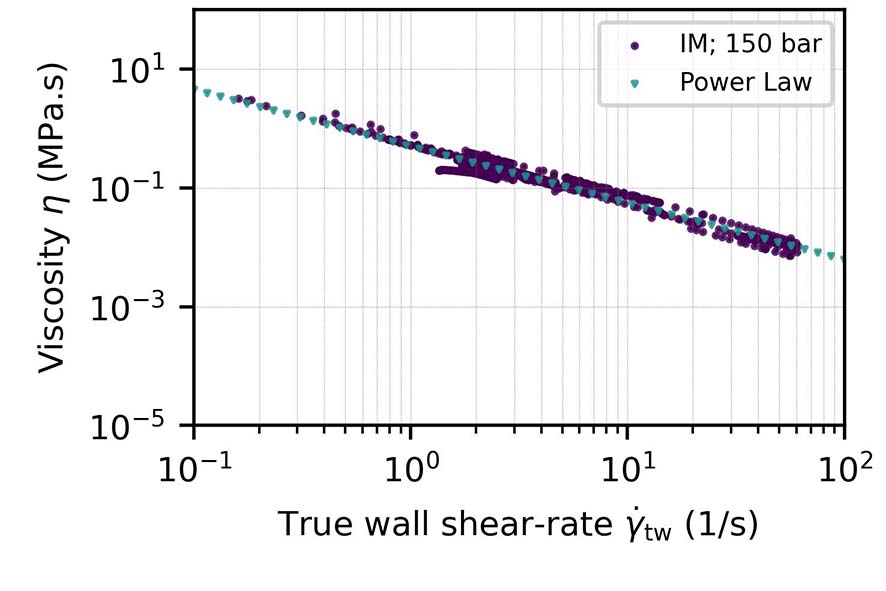
Experimental plaque molding trials are adopted for in-mold (IM) characterization of viscosity on part level. The viscosity is determined as a function of the shear-rate through the gap height and force signal recorded by the press using the similarity between press and slit rheometry. The exemplary result reveals that a Power Law model is highly suitable to describe the shear-thinning behavior of the viscosity.  

In-mold viscosity (IM) and related Power Law model fit for an exemplary replicate.

Rheometer characterization

Viscosity is characterized on coupon level using different rheometer setups in oscillatory mode and small strain regime. Here, a plate-plate (PP) and a torsion bar (TB) setup are used. The exemplary result at 280 °C reveals a significantly higher viscosity for the torsion bar compared to the plate-plate tests, which results from the in-plane alignment of the fibers.

Comparison of plate-plate (PP) and torsion bar (TB) rheometer results at 280 °C.

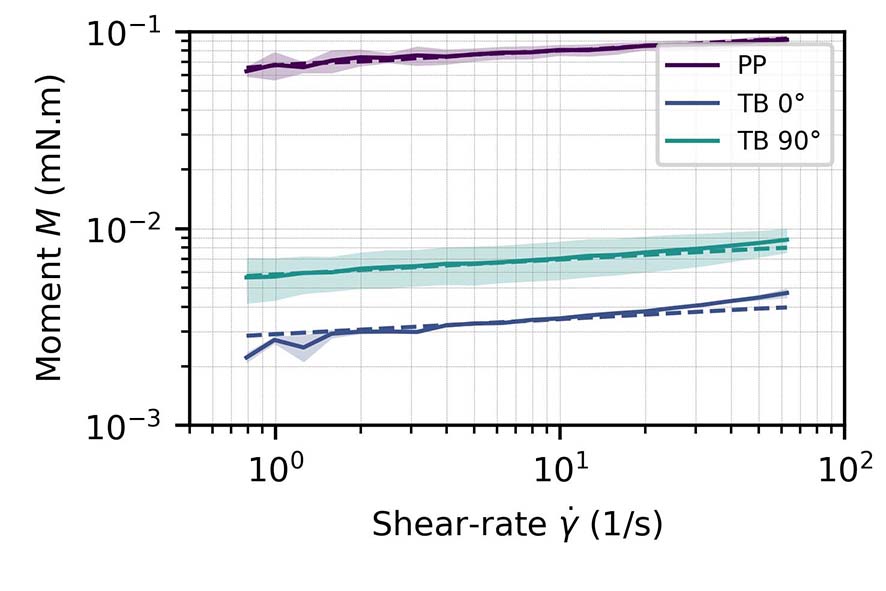
Shaqfeh-Fredricksen’s equation is used to describe the anisotropic viscosity of the composite as a function of fiber orientation, fiber length, and fiber volume content. The composite properties are known from µCT and the technical datasheet so that the remaining magnitude is the effective viscosity, which is described for fitting by a Power Law model. The exemplary fitting result reveals that the adopted constitutive equation can describe the anisotropic viscosity measured on the coupon level.

Comparison of the fitting result for anisotropic viscosity at 280 °C to experimental tests.

Correlation in-mold and rheometer characterization

In-mold and plate-plate rheometer characterization is compared. A high degree of agreement between the two different testing methods is observed. Moreover, the plate-plate rheometer characterization results reveal that the shear-thinning dominates the temperature-dependency of viscosity.


Comparison of in-mold (IM) to plate-plate (PP) rheometer results.

Validation of Molding Simulation

Plaque

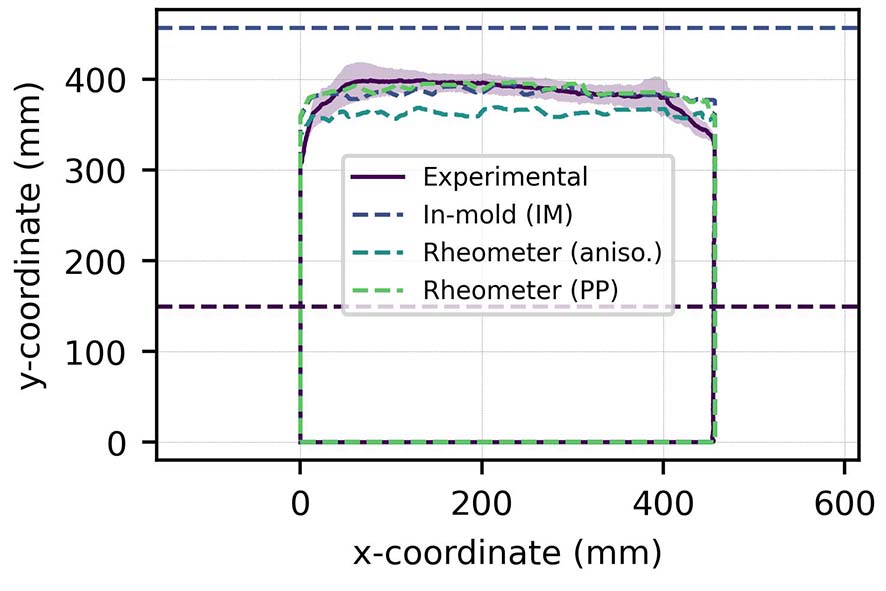
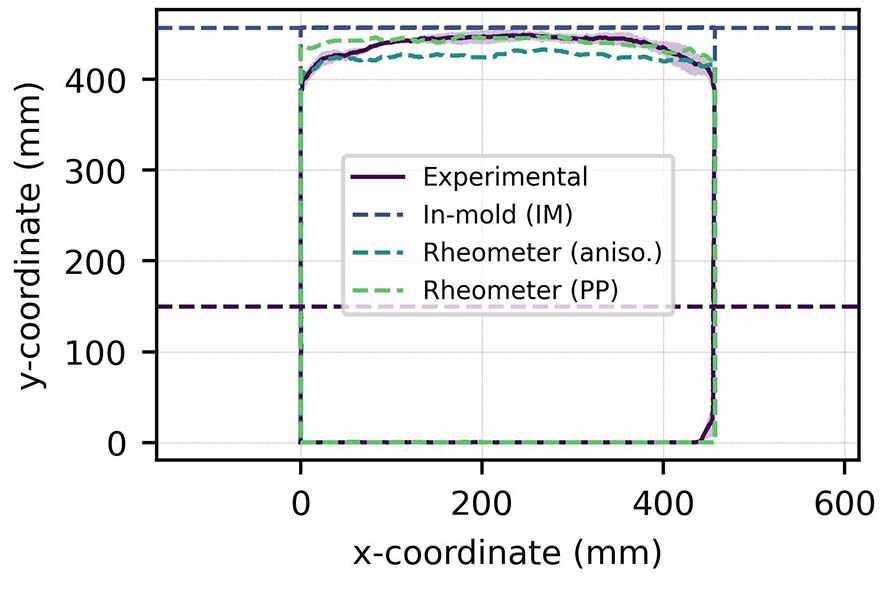
The molding of plaque does include material forming. Therefore, only material flow is considered for molding simulation. Three different viscosity parameterizations are considered for validation. These are the isotropic in-mold parameterization, the anisotropic rheometer parametrization, and the isotropic rheometer parameterization using the plate-plate rheometer results. 


The results from the molding simulation are correlated to three experimental replicates. A high degree of correlation is observed for the rheometer isotropic parameterization for both maximum specific pressures. The in-mold viscosity parameterization yields a similar correlation for 150 bar but predicts a filled plaque for 300 bar. Here, it is to be noted that the plaque is almost filled at 300 bar. A good correlation is achieved with the rheometer anisotropic viscosity parameterization, but the flow lengths are systematically lower compared to the other viscosity parameterizations.

Validation results for the plaque geometry at 300 and 150 bar.


Hat Section

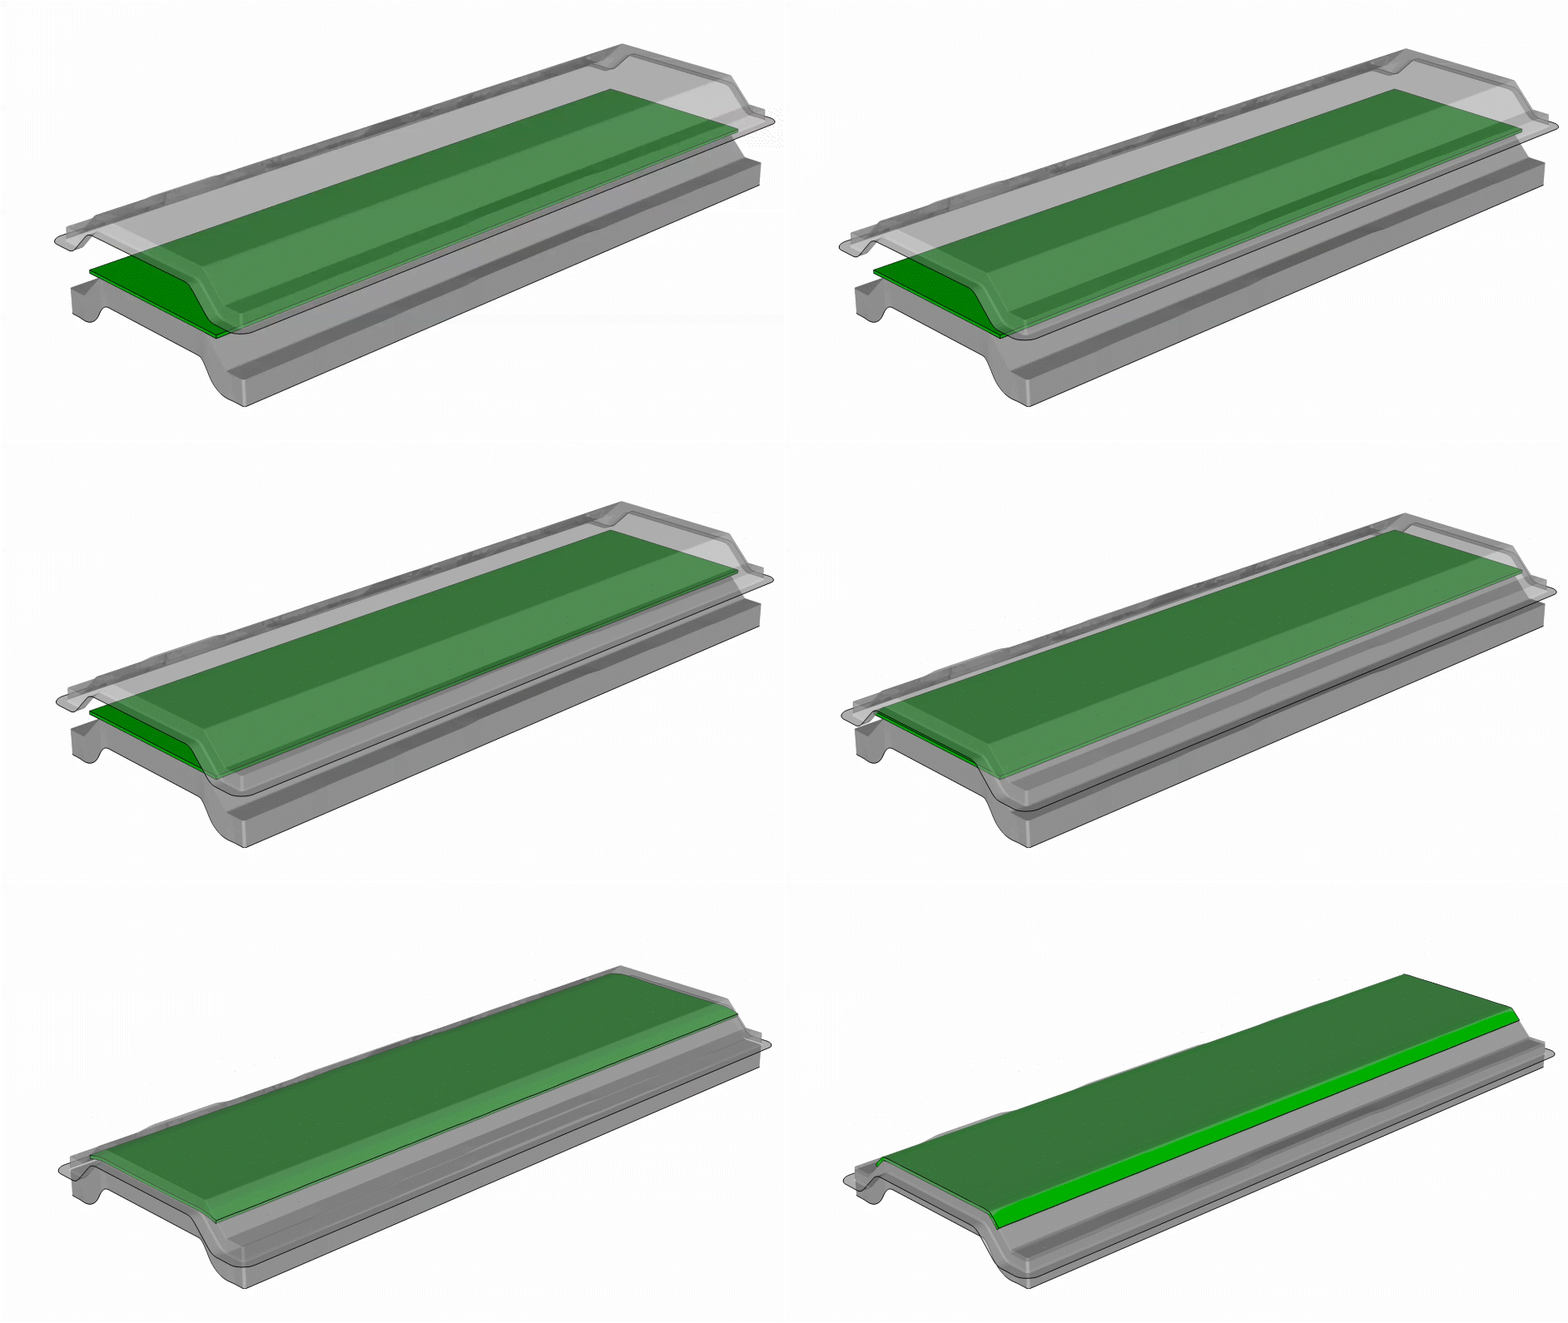
A hat section geometry is used for validation as geometry with intermediate complexity. Here, a forming simulation is conducted and the results are transferred to initialize the material occupation and local fiber orientation for flow simulation. Since molding is dominated by material flow, the plate-plate rheometer parameterization is used for simplicity.  


The results for a single sheet with an initial thickness of 4 mm and a maximum specific pressure of 500 bar yield a complete filling of the mold.


Simulation of material forming and material flow for the hat section geometry.

Experimental tests with varying maximum specific pressures are compared to the related molding simulation for validation for a single replicate experiment. A filled mold is predicted in agreement with the experimental test for 500 bar. In contrast, incomplete mold filling is predicted for 300 bar and 100 bar maximum specific pressure. This agrees with the experimental tests. However, slightly shorter flow lengths as observed in experimental tests are predicted by simulation.


Validation of flow length for different molding pressures (500 bar, 300 bar, and 100 bar).


Seatback Outer


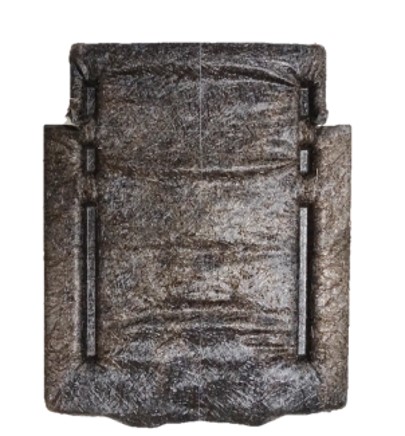
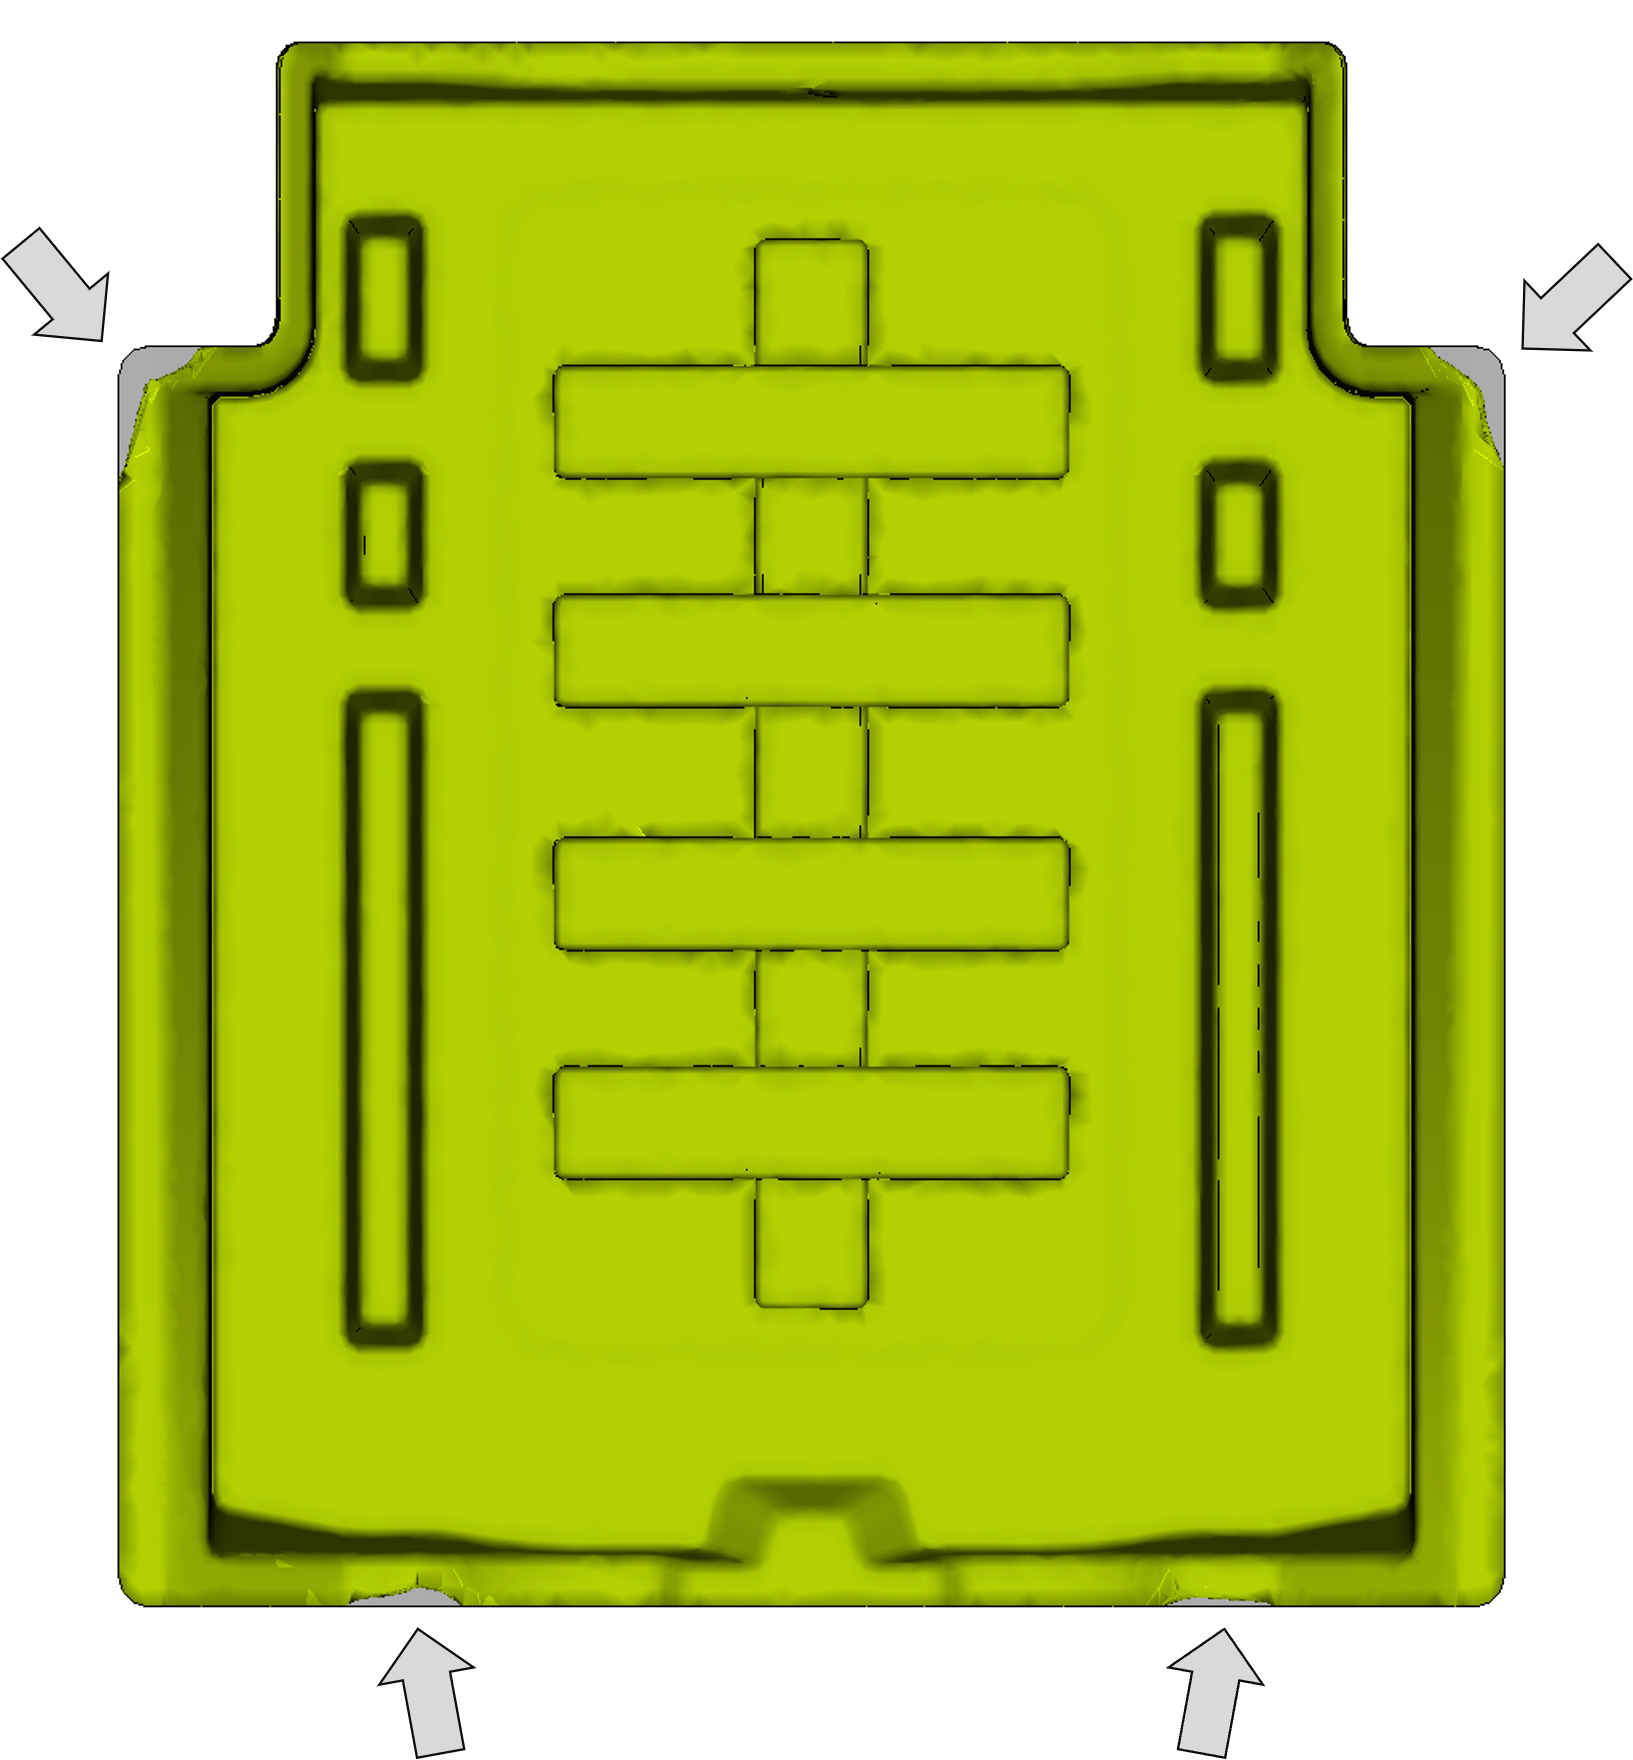
Finally, the so-called seatback outer geometry, which is a complex geometry with deep drawing pockets and beads, is adopted to validate molding simulation also for a complexly shaped geometry. For forming simulation, the anisotropic and the isotropic rheometer parameterization are considered. A sheet tailoring to prevent any material shear-off due to the shear-edge mold is chosen.  


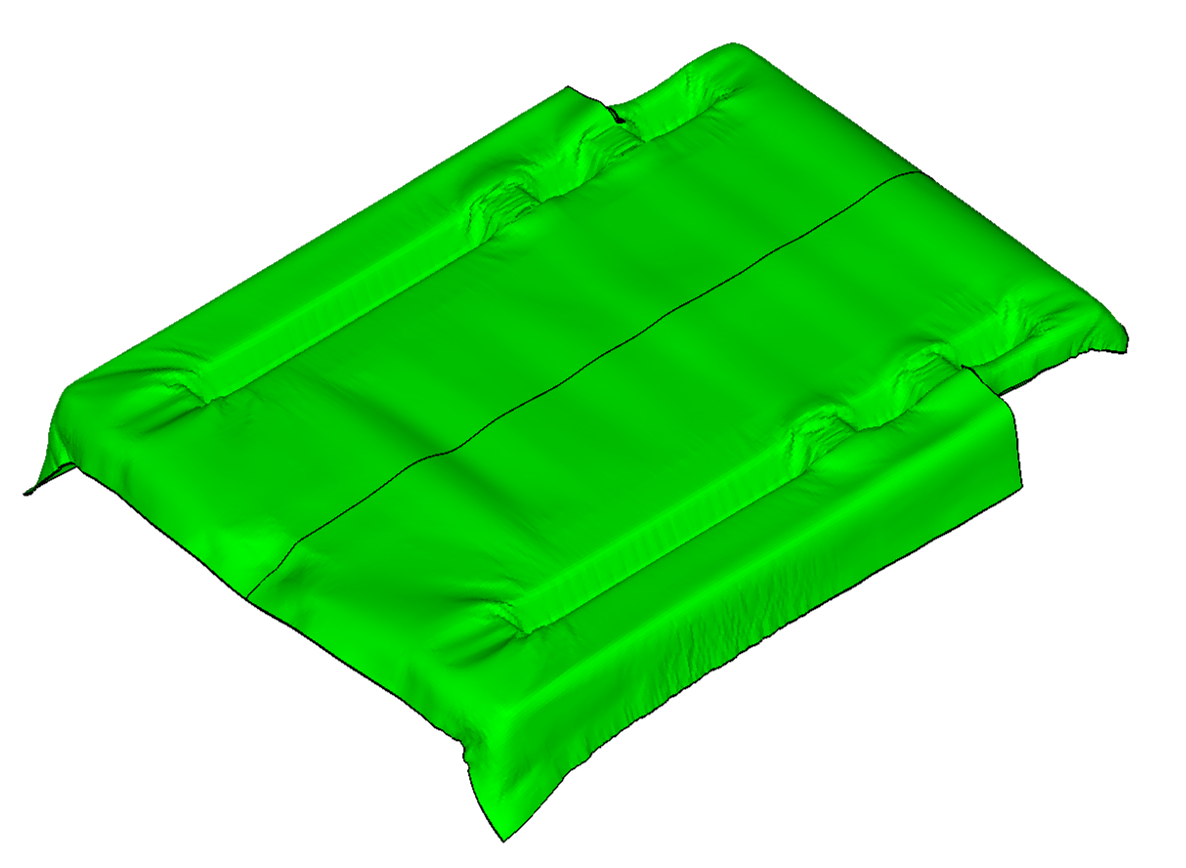
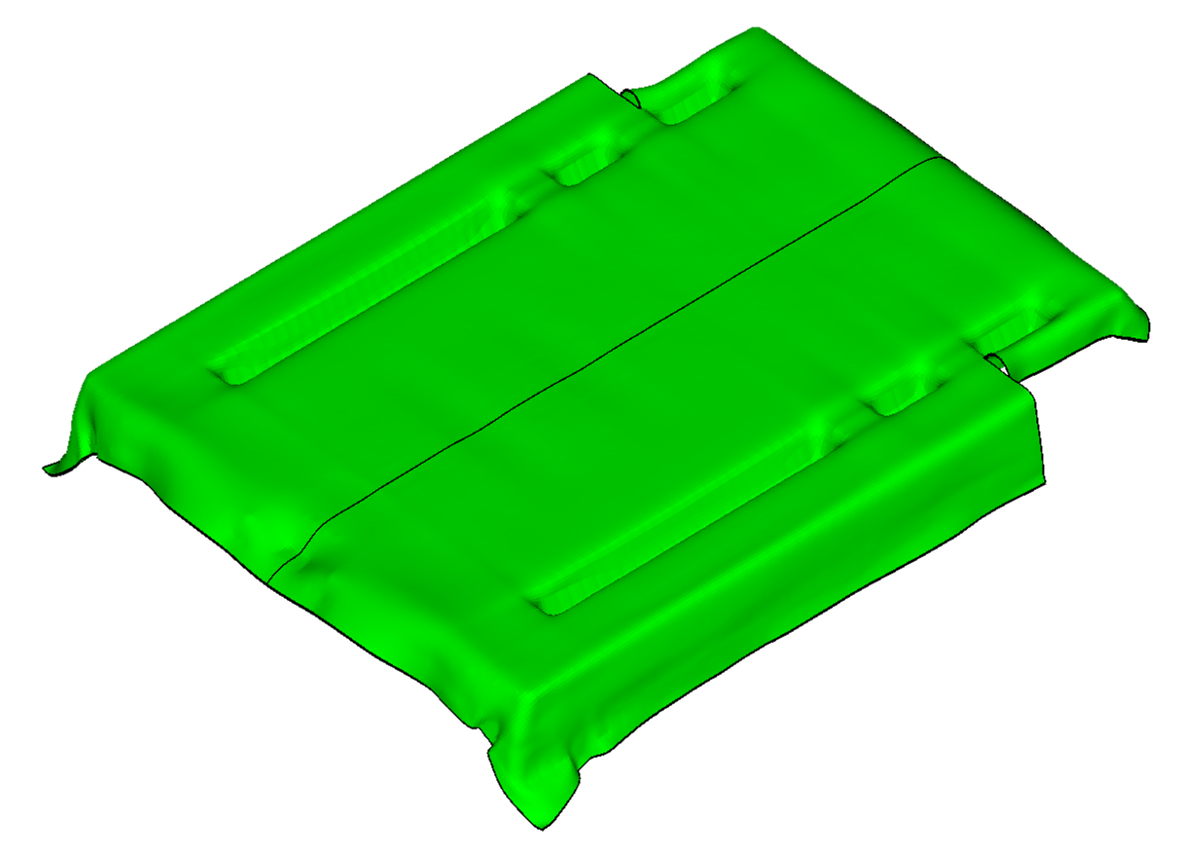
The comparison of an experimental result to the related simulation results reveals that with the anisotropic viscosity parameterization, the horizontal wrinkling between the deep drawing pockets, the vertical wrinkling below the deep drawing pockets, as well as the vertical material accumulation between the deep drawing pockets are in agreement with the experimental test, although especially the horizontal wrinkling is predicted less pronounced. In contrast, no wrinkling due to forming of the deep drawing pockets is predicted through the isotropic viscosity parameterization. 

Comparison of an experimentally partly formed part forming simulation:

Forming simulation result with anisotropic viscosity

Forming simulation result with isotropic viscosity

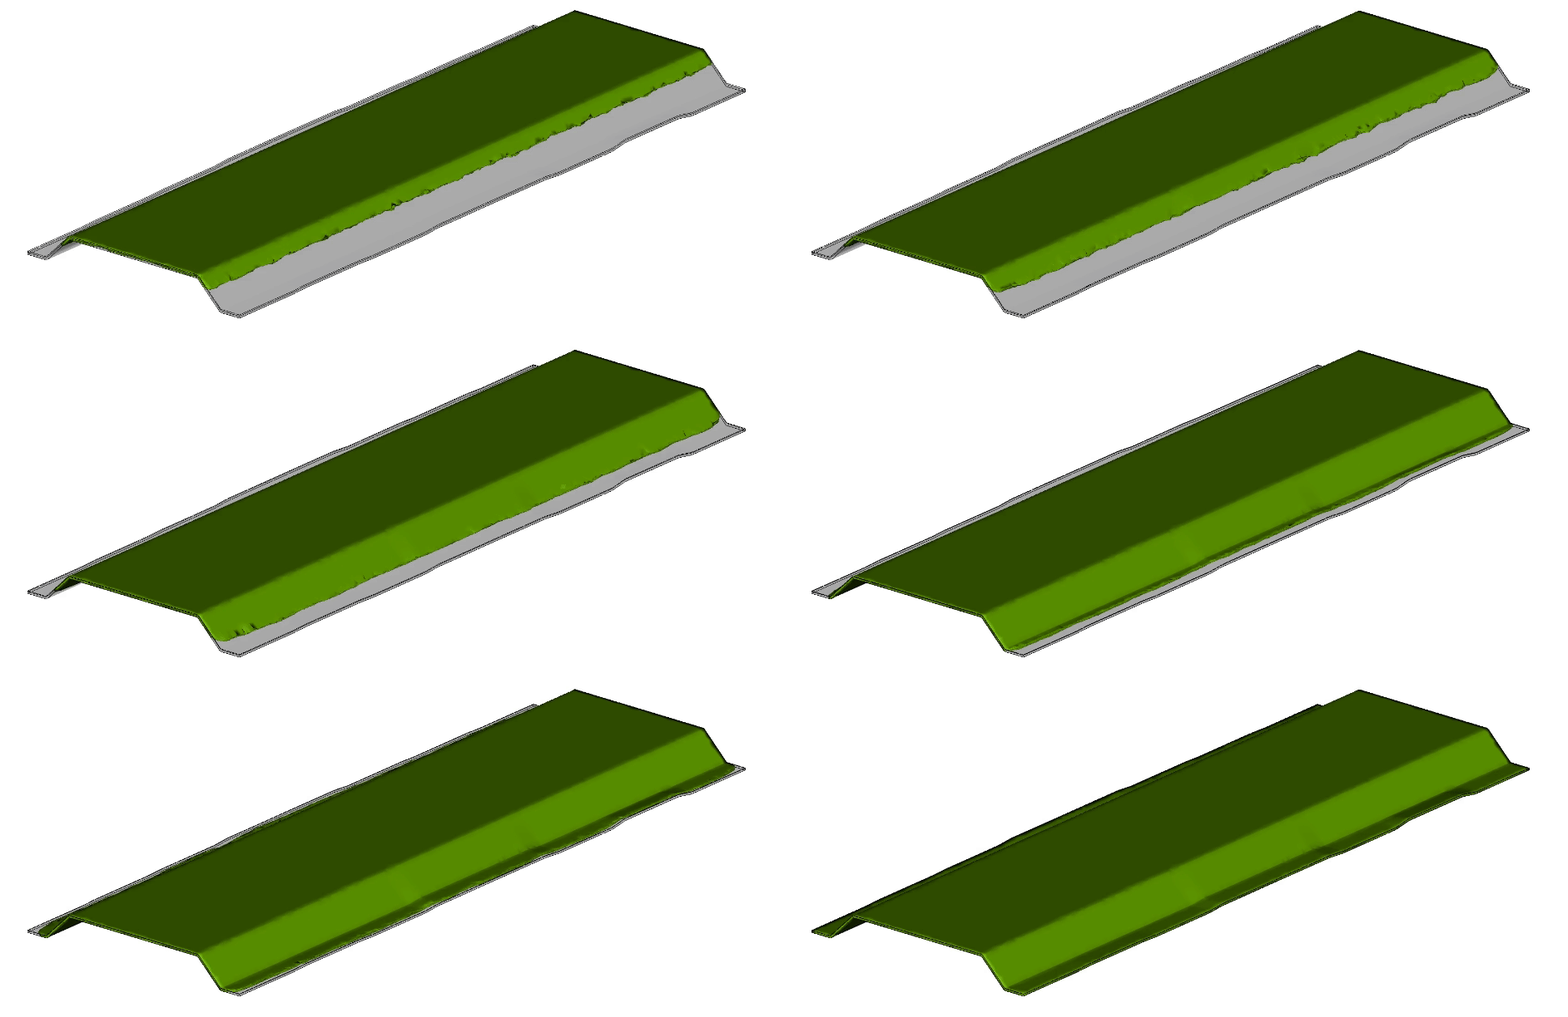
Another sheet tailoring is considered for validation of flow simulation. This tailoring maximizes the material occupation before the onset of material flow but results in material shear-off due to the shear-edge of the mold.  


Incomplete mold filling is observed in four replicate experiments at 300 bar maximum specific pressure. Flow simulation predicts incompletely filled part areas in agreement with the experimental tests. A symmetric result is obtained in simulation, whereas a slight asymmetry is observed in the experimental test.

Experimental result fully molded hat section

Simulation result from material flow simulation

References

  1. D. Dörr et al., Rheological Characterization and Macroscopic Modeling and Simulation of the Molding Process of a PA6 Glass Mat Thermoplastic (GMT), Journal of Composites: Part A, 2022. 
  2. D. Dörr et al., Experimental and predictive analysis of the molding behavior of a PA6 Glass Mat Thermoplastic (GMT), Journal of Composite: Part B, 2022

Any questions?

Do not hesitate to get in contact with us if you have any questions or if you are interested in a collaboration. We are pleased if you leave us a message!